Let’s examine the insights shared by our Technical Analyst at UseTheBitcoin as he walks us through his personal trading approach and observations on the crypto market.
POPCAT Market Update
First, looking at the daily chart, we can see that POPCAT has been trading within a consolidation range for some time now. After hitting a recent high at around $1.56, the price hovers just below the important resistance level of $1.50. This level has acted as a psychological barrier for the market, with buyers and sellers hesitating to push through.
Consolidation periods like this one typically indicate that the market pauses a significant price movement. Traders are waiting for more signals or volume to drive the price in one direction. Right now, the price is sitting slightly below this resistance line at $1.40. The market seems to be waiting for a decisive move, either breaking above the resistance level to signal a bullish continuation or retracing back down for a potential dip.
It’s worth noting that during this period of consolidation, the candles have been relatively small, which shows that volatility has decreased. This is common before a major breakout, so we could soon be gearing up for a big move.
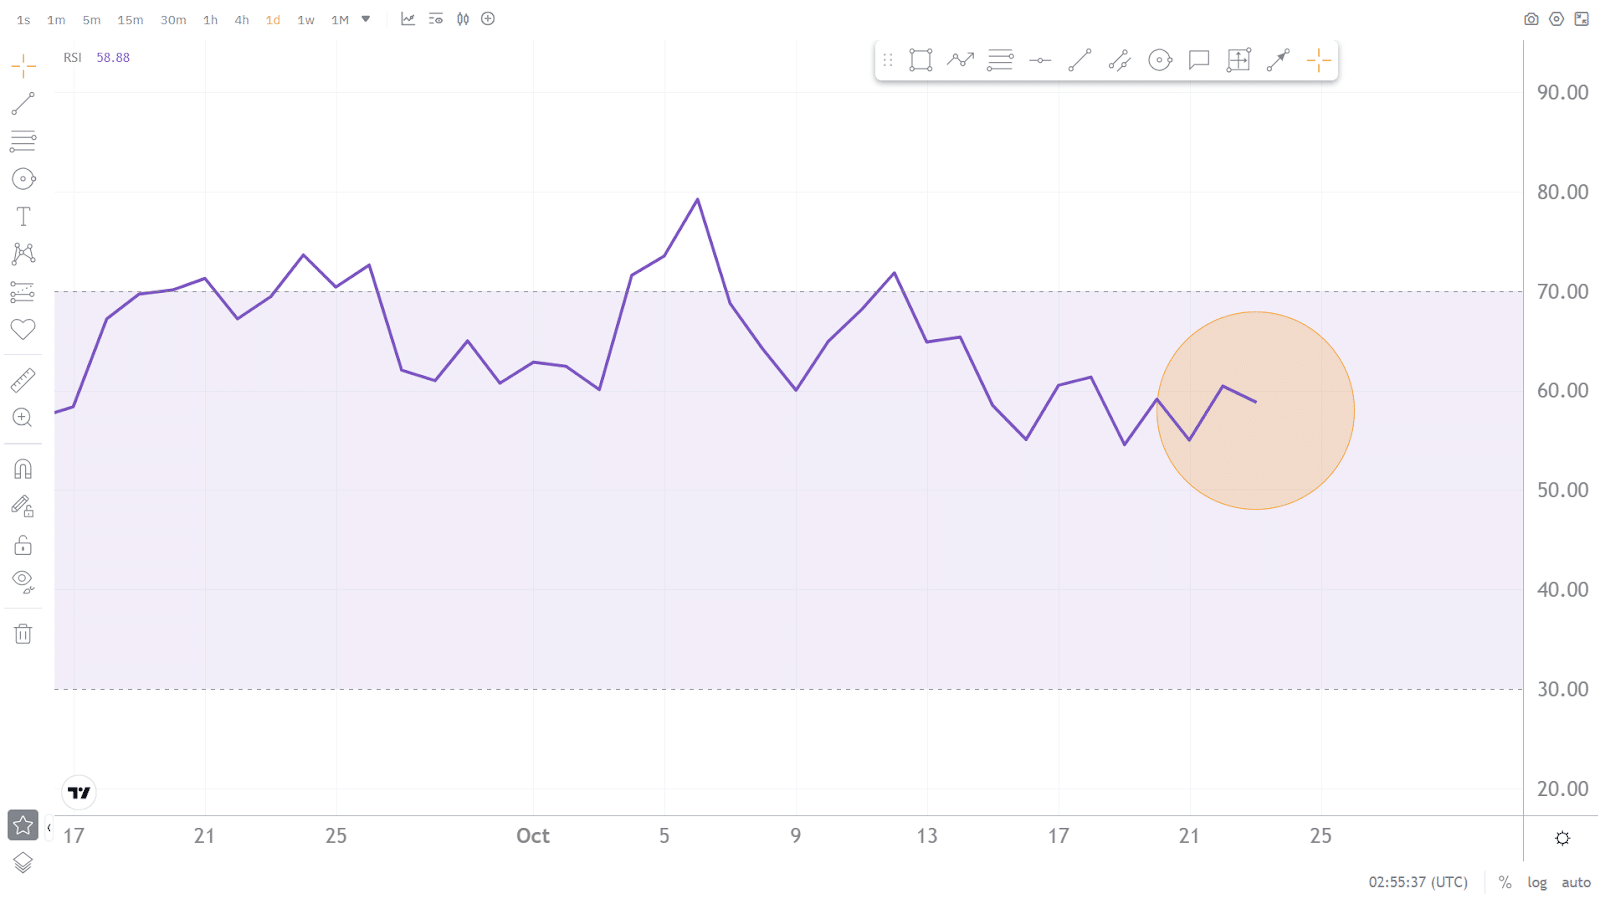
Now, moving on to one of our key indicators—the Relative Strength Index, or RSI. Currently, the RSI is at 59.81, which suggests that the asset is in neutral territory. It’s neither overbought nor oversold, meaning there’s still room for the bulls to push the price higher if the momentum builds. However, the fact that the RSI hasn’t reached 70 shows no significant upward momentum yet.
The RSI is crucial because it helps us understand whether an asset is potentially overbought or oversold. In recent weeks, the RSI has fluctuated between 40 and 70, suggesting that POPCAT is experiencing sideways movement without a strong directional bias. This aligns with the consolidation pattern we’re seeing in the price action.
If the RSI rises above 70, it would indicate overbought conditions, which may lead to a correction. However, seeing the RSI dip closer to 30 could suggest oversold conditions, making it a potential buying opportunity for traders. For now, though, we’re in a range where the market could swing either way.

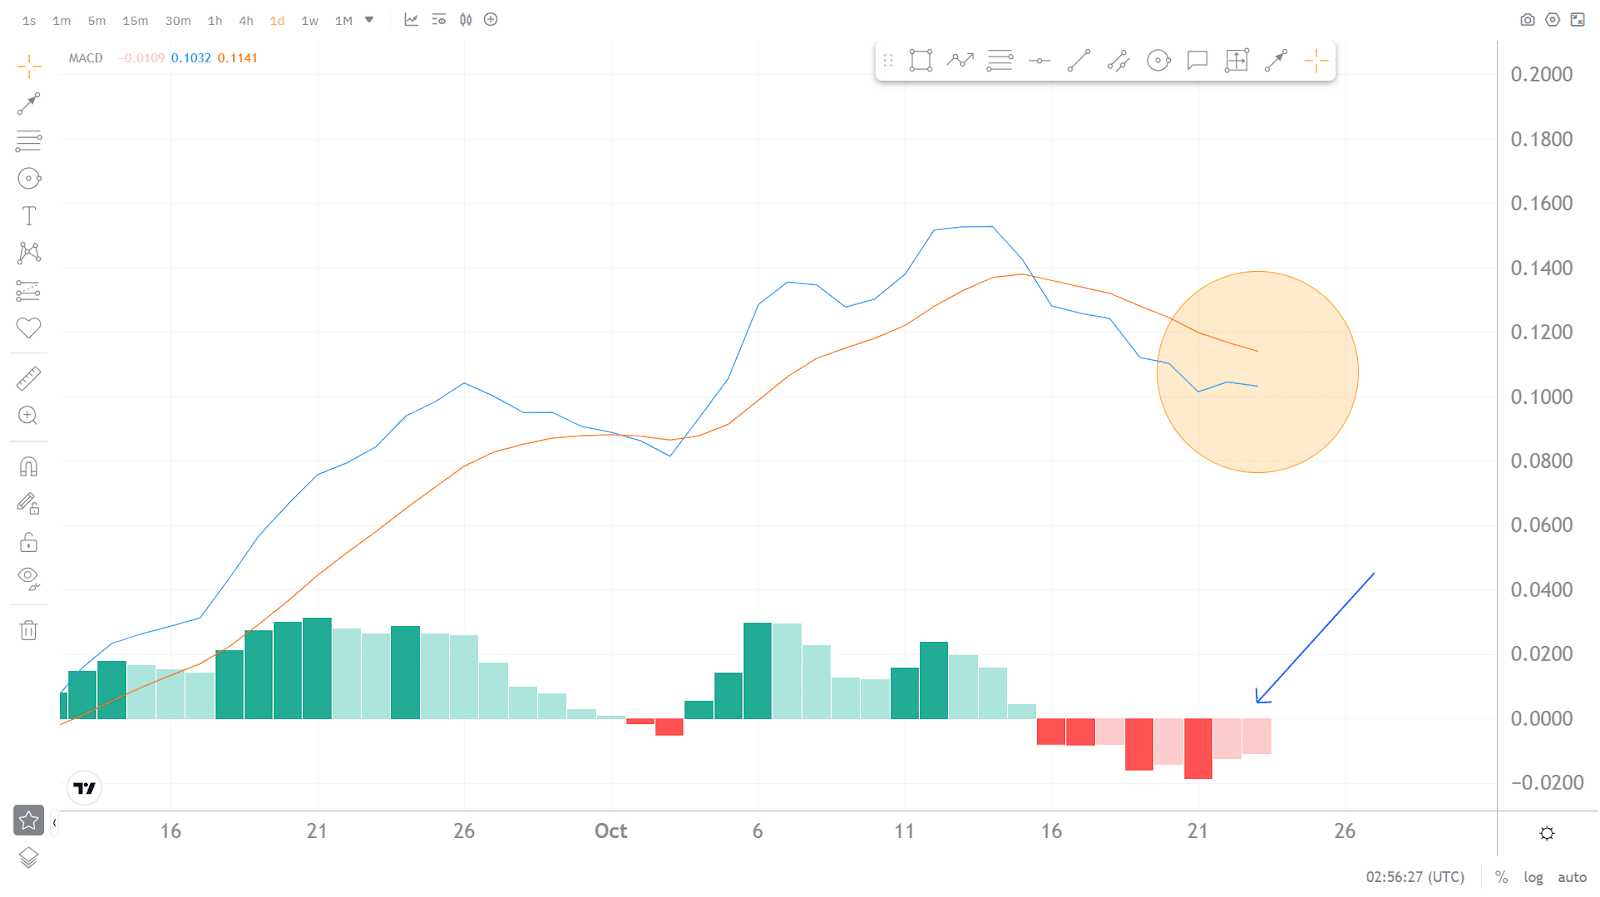
Next, let’s turn to another popular momentum indicator: the MACD, or Moving Average Convergence Divergence. The blue MACD line is slightly below the orange signal line, but both are very close. This proximity indicates a lack of solid momentum in either direction. The MACD histogram shows small red bars, which indicates that a potential bearish crossover could be in the making if the trend continues.
This suggests that while the bulls have been holding on for the moment, the momentum is starting to fade. If the MACD continues to move below the signal line, we could see a potential short-term bearish move, with prices pulling back toward key support levels.
It’s important to watch the MACD closely here because a definitive crossover below the signal line could be the early warning sign of a more significant downward move. Conversely, if the MACD rises above the signal line, we could see bullish momentum come back into play.

Speaking of support, if POPCAT fails to break through the $1.50 resistance, we’re likely looking at support around the $1.00 mark. This level has previously acted as a solid floor, and it will be critical if the price drops, as buyers could step in to defend this zone. The $1.00 level also represents a strong psychological barrier—if it holds, we could see a reversal or bounce from that area.

On the upside, if we manage to break the $1.50 resistance level, we could see a quick rally toward the next psychological resistance at $1.60. Historically, once a key resistance level is broken, we often see an influx of buying volume, which propels the price higher. However, for any significant breakout, we must see volume increase to confirm the move.

Final Thoughts
In conclusion, POPCAT is currently in a wait-and-see mode. We’re at a key resistance point of $1.50; the RSI and MACD both give neutral signals. Traders should keep a close eye on the price action near this level. If we break above with sufficient volume, the bulls could take control, driving the price toward $1.60 or higher. However, if we see a rejection at this resistance, expect a pullback to the $1.00 support level.
This is a market to watch, as the consolidation phase could end with a significant move in either direction. Remember, patience is key during consolidation periods like this, so keep your indicators in mind and always look for confirmation before entering a trade.
For more in-depth technical analysis like this one, make sure to subscribe and hit the notification bell on UseTheBitcoin’s YouTube channel. We post daily videos covering the crypto markets, so don’t miss out!
